Day 26: let AI find your best posts
Your analytics already know what’s working. Here’s how to make them talk.
|
|
|
|
DAY 26
/
DAILY DROP
ANALYTICS, AI-ASSISTED
|
let AI find your
best posts
|
|
A few of you asked whether we’d cover analytics, so here it is. Your data already knows what’s working. The problem is that “best” means different things depending on what you’re after, and Instagram’s built-in insights won’t rank your posts by your definition of success.
Fair warning though: this is a long one. Longer than anything else I’ve sent you. And while there’s nothing to film today, analytics aren’t something to skim.
So don’t feel like you have to cram this into today. Find an hour sometime this week, sit down properly, and use this email as your guide while you go. It’ll still be here.
|
|
/ STEP 1
export your data
|
|
You’re grabbing two CSVs from Meta Business Suite (posts and stories, last 90 days) plus a few screenshots from your Professional dashboard. All of it goes to the AI together.
I made you a guide with screenshots of every single click, so just follow along there and come back when you’ve got your files. Takes about 5 minutes, and you’ll want a laptop for it.
|
|
/ STEP 2
what you’re about to get back
|
|
The prompt gives you three separate lists of your top posts, because “best” depends on what you’re after:
By reach — how many people saw it.
By follows — how many of those people stuck around.
By total engagement — likes, comments, saves and shares added together.
One note on that last one: it’s a straight total. It adds those four up and treats them equally, even though the algorithm doesn’t. A share is worth more than a like in the real world. This just tells you which posts got people doing something, which is still useful. If you want them ranked by actual weight, that’s what the Edits trick below is for.
Then it flags any post that shows up on more than one list. Those are the ones doing multiple jobs at once, and they’re the formats worth repeating.
It also works out your follows per 1,000 reach, which I’d argue is the more interesting number. A post can be seen by a hundred thousand people and convert nobody. This tells you which posts punched above their distribution, and which big ones quietly did nothing for you.
One heads up: it’ll finish by handing you a short list of posts to go screenshot. That’s on purpose, and it’s the most important part. More on that below.
|
|
/ STEP 3
paste this prompt into your AI
|
|
Upload both CSVs and your screenshots to ChatGPT, Claude, or whatever you use, then paste this. It handles the rest.
|
I’m attaching my Instagram data: a Posts CSV export and a Stories CSV export from Meta Business Suite (last 90 days), plus screenshots of my account insights — follower growth, account reach, non-follower reach, profile visits vs follows, top locations, age and gender, and most active times.
Before you start: confirm the files actually came through and tell me which columns you found. If the Posts export is missing Follows, Saves, Comments, or Shares, say so and tell me what you can and can’t build without them. If my export includes posts from accounts that aren’t mine (collabs, podcast features, reposts), exclude them and tell me how many you dropped.
PART 1 — THREE RANKED LISTS
Give me three separate ranked lists. Top 10 each, with a shortened description, the permalink, and the relevant numbers.
1. Top posts by REACH — how many people saw it
2. Top posts by FOLLOWS — how many new followers it brought in
3. Top posts by TOTAL ENGAGEMENT — likes + comments + saves + shares added into one total. Do not weight them, just add them up, and show me the total alongside the breakdown.
PART 2 — OVERLAPS
Tell me which posts show up on more than one list. Call those out clearly. A post that ranks for reach and follows, or engagement and follows, is doing more than one job at once, and that’s the format I should be repeating.
PART 3 — EFFICIENCY, NOT JUST VOLUME
Also calculate follows per 1,000 reach for every post above a meaningful reach threshold, and show me the top 10. Raw reach can hide the fact that a post got seen by a million people and converted nobody. I want to know which posts punch above their distribution.
Flag any post with huge reach and weak follows, and any post with modest reach and strong follows. Those two groups are where the lesson is.
PART 4 — WHAT THE WINNERS HAVE IN COMMON
Read the actual description text and be specific about the hooks, topics, and formats that keep showing up. Not “post more video” — I want to know which sentence structures, which subjects, which openers.
Specifically check:
• Do my top performers cluster around a repeated hook or phrase? If so, how many posts used it, what share of my total follows came from those posts, and what’s the MEDIAN performance of that format (not just the best one)?
• Is the same hook doing different jobs? Some hooks drive follows but not comments. Some do the reverse. Tell me which is which.
• Separate FORMAT from HOOK. If carousels look worse than reels, check whether that’s really the format or whether I just happen to use carousels for my weaker content. Compare like-for-like where you can.
• Do I use a comment-based CTA (“comment RECIPE and I’ll send it”)? Compare posts with and without one on comments and reach.
• Sponsored vs organic — but only if I have enough sponsored posts to say anything real. If it’s under about 10, tell me it’s too thin instead of drawing a conclusion.
• Posting time — but check whether I actually vary my posting time before you analyze it. If 80% of my posts go out in the same 3-hour window, the comparison is confounded and you should say so rather than pretend it isn’t.
PART 5 — STORIES AND SCREENSHOTS AS CONTEXT
Use my Stories export and my screenshots to tell me what my audience responds to, who they are, and when they’re active.
For stories, note that link clicks and replies usually come from different stories — a story with a link sticker gets clicks and almost no replies, and vice versa. Don’t compare them head to head. Rank them separately and tell me what the top of each list has in common.
From the screenshots, tell me: what share of my reach is non-followers, what my follower-to-profile-visit conversion looks like, and whether my audience demographics match who I think I’m making content for.
If the numbers in my screenshots disagree with the numbers in my CSV export, say so plainly. Don’t quietly pick one. In-app panels and CSV exports sometimes attribute differently and I’d rather know than be given a false reconciliation.
PART 6 — THE ON-SCREEN HOOK
Important: my CSV only contains CAPTION text. It does not contain the words that appear ON SCREEN in my videos. Most people never expand the caption, so the on-screen text is usually the thing actually stopping the scroll.
So: after you’ve given me the lists above, give me a short checklist of the unique posts across all three top-10 lists, in priority order, so I can go screenshot the on-screen hook for each one and send them back to you. Include the permalink and the key numbers for each so I can match them up.
Once I send those, redo the pattern analysis in Part 4 against the on-screen text instead of the captions, and tell me where the two layers disagree.
PART 7 — HONESTY REQUIREMENTS
This part matters more than the rest.
• If one post is responsible for most of my follows, say so and tell me what percentage. Don’t present a top 10 as if all ten are meaningful when ranks 8-10 are separated by noise.
• If a pattern rests on one or two posts, call it promising, not proven.
• If a sample is too small to support a conclusion, say “not enough data” instead of hedging your way into an answer.
• If my data contradicts standard content advice, go with my data and tell me it’s contradicting the usual advice.
• Don’t force a pattern to fill out a section. A short honest answer beats a long confident one.
PART 8 — WHAT TO DO NEXT
Finish with two lists:
• 5 content ideas for my niche, based ONLY on what my data shows is already working. Not generic advice. Each one should point back to a specific post or pattern in my export, and say what metric it’s designed to move.
• 5 hook ideas I could actually use, written in the style of the hooks that performed best for ME. Model the sentence structure of my own winners — don’t give me generic viral formulas.
For both lists, if the supporting evidence is a single post, say so.
|
|
|
/ WHY THIS BEATS INSTAGRAM’S INSIGHTS
Instagram shows you top posts by reach, or by one metric at a time. It won’t line up three different definitions of “best” side by side and show you which posts win on more than one. And it will never look at the actual hook on your screen and tell you what your winners have in common — but the AI will, once you send it those screenshots.
That pattern, the thing your best posts share, is your own personal playbook. Honestly it’s worth more than any advice I can give you, because it’s built from your audience, not mine.
|
|
|
/ THE 30-SECOND VERSION
the Edits app tells you more than Instagram does
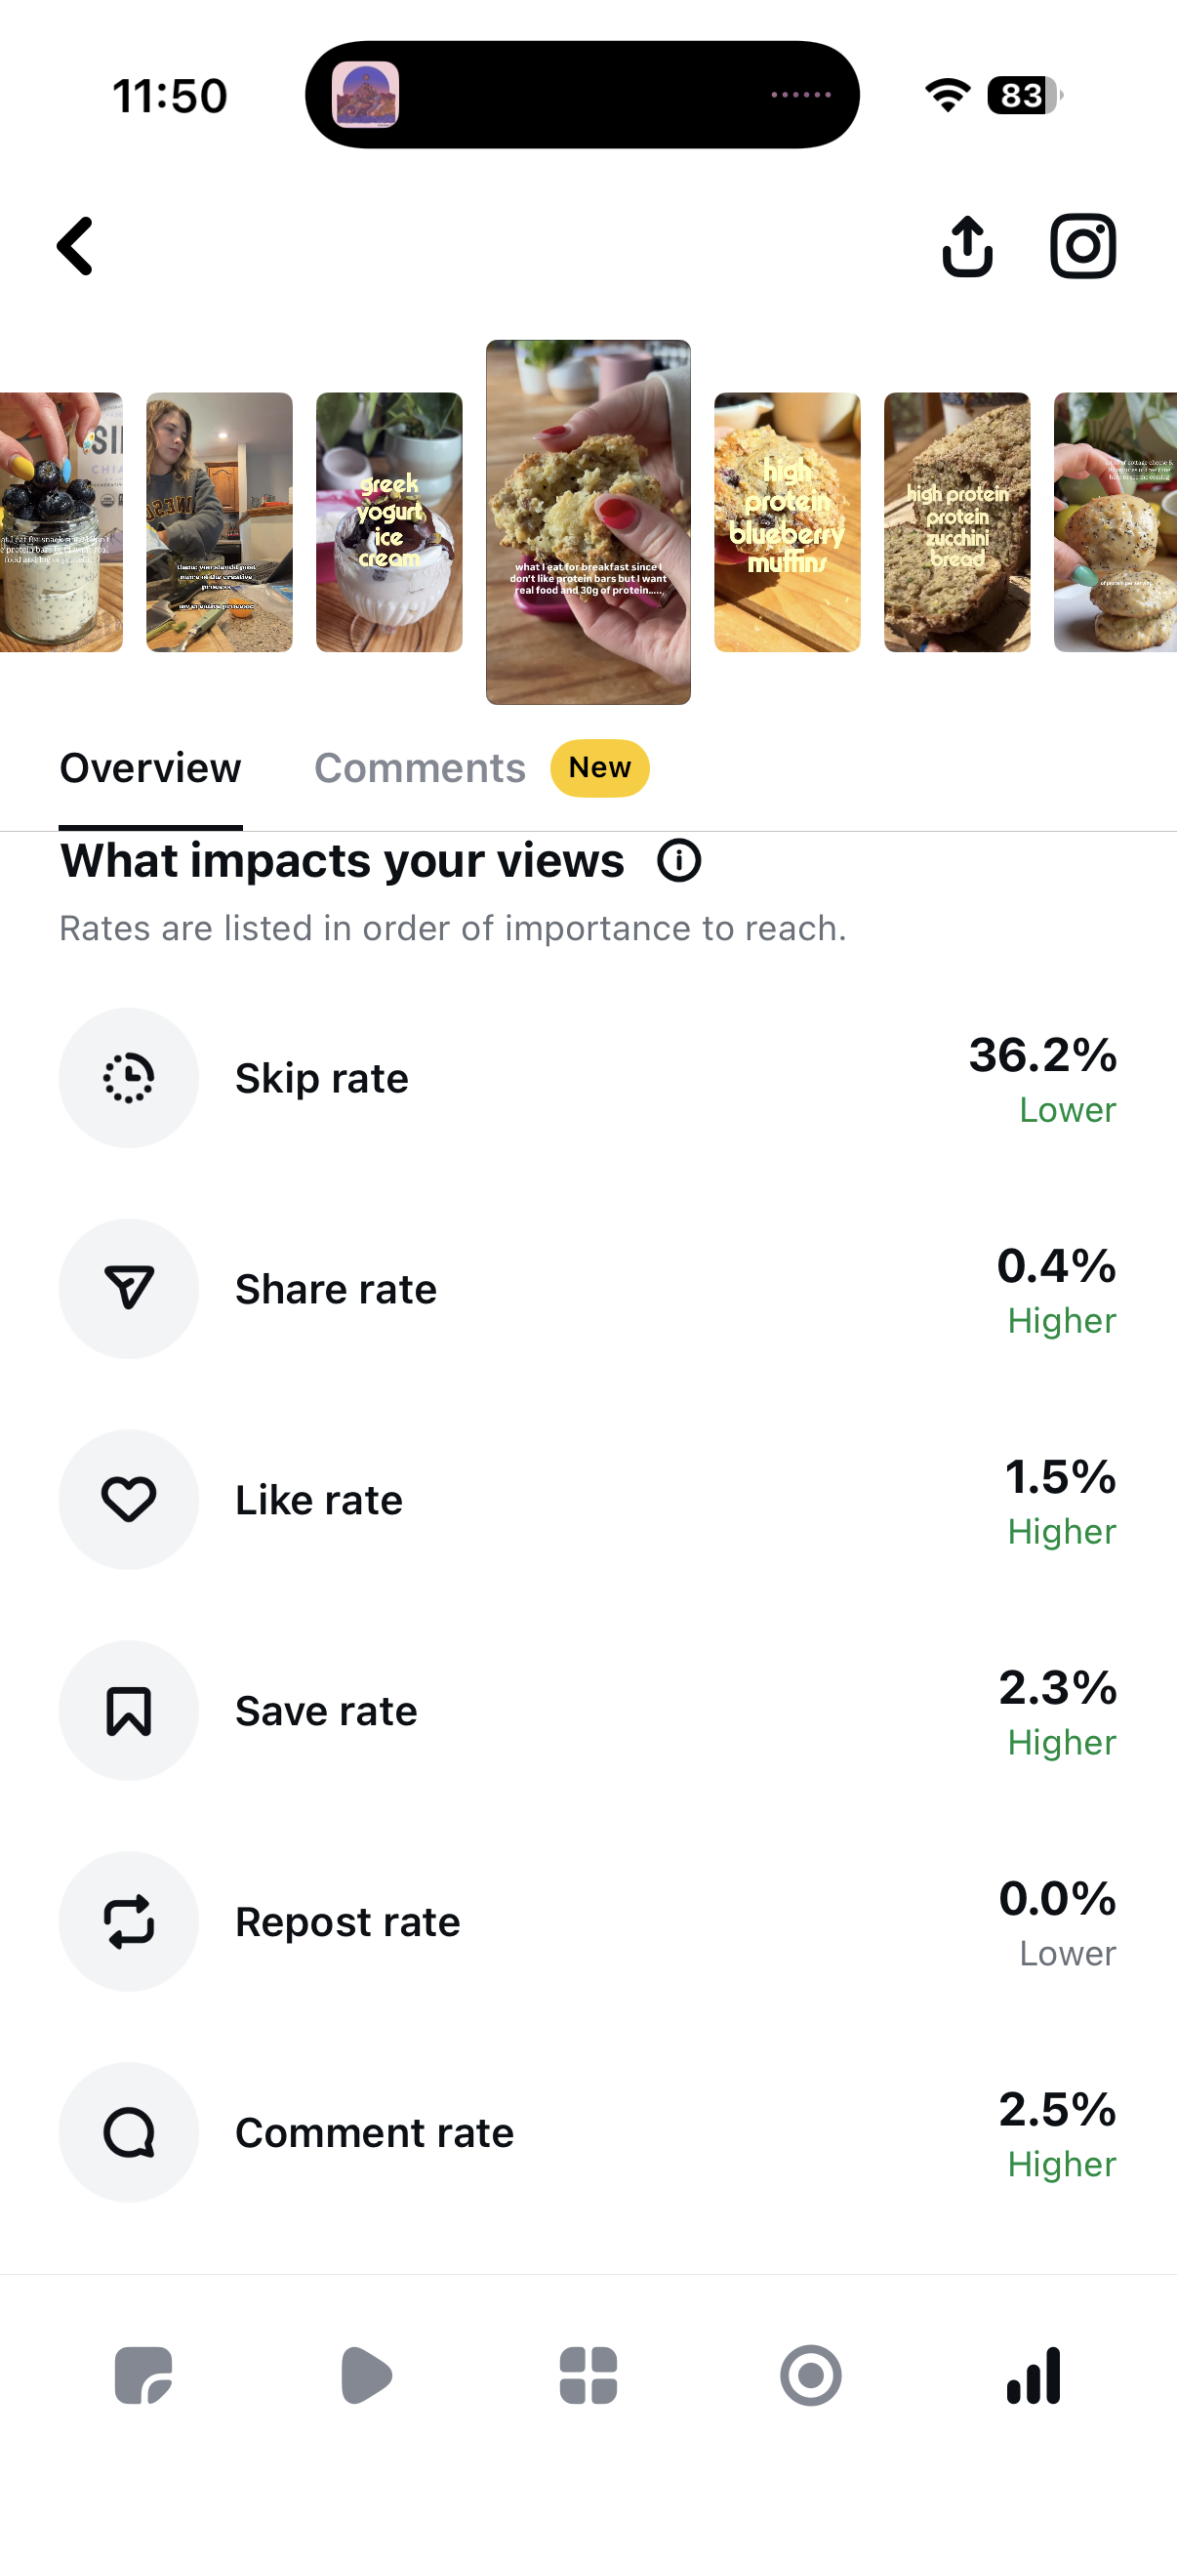
If the whole CSV thing isn’t your world, don’t skip today entirely. Open Edits, tap into one of your published videos, and look at the engagement breakdown.
Here’s the part I love: it lists the engagement types in order of how much the algorithm actually weights them. Instagram’s own insights just hand you a pile of numbers and let you guess which ones matter. Edits puts them in order for you.
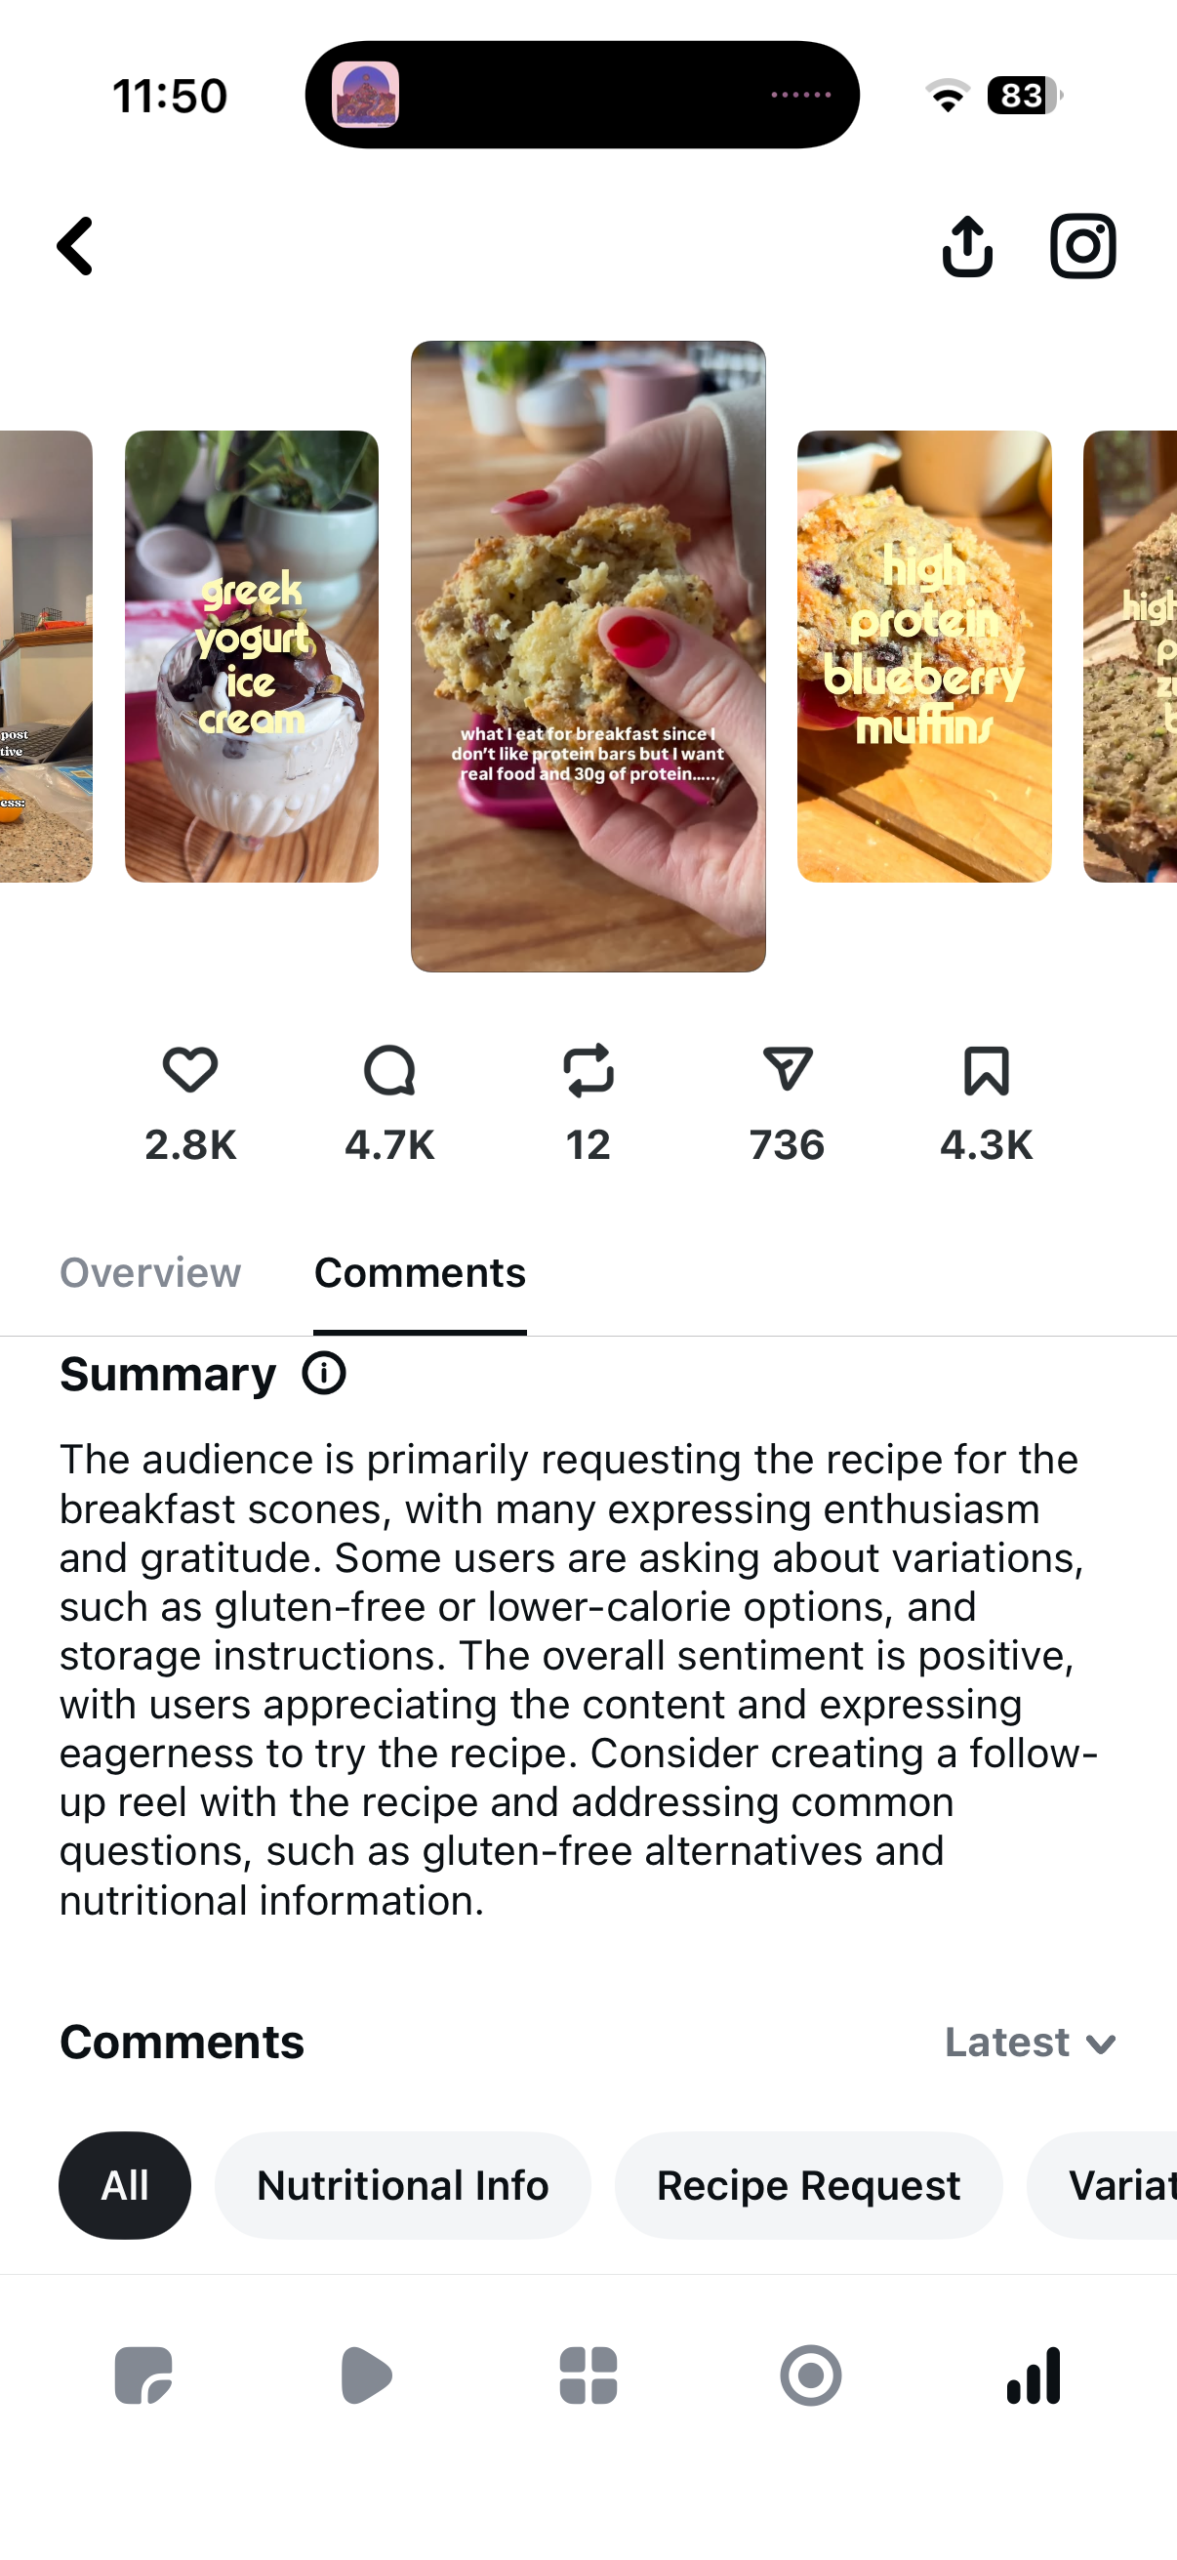
While you’re in there, it also gives you an AI summary of your comments, so you can see what people are actually saying without scrolling through all of them one by one.
|
ENGAGEMENT, IN ORDER OF WEIGHT
|
THE AI COMMENT SUMMARY
|
Go look at your best post and your worst one and compare. You’ll learn a lot in about thirty seconds.
|
|
|
/ THREE THINGS I LEARNED RUNNING THIS
the on-screen text is usually the real hook
Meta’s export only gives you the caption. It has no idea what words are on screen in your video. On my own account those two were completely different, and the on-screen text was the thing doing the work.
That’s why the prompt asks you to go screenshot your top posts and send them back. It’s an extra step and I know it’s annoying, but skip it and you’re analyzing the layer most people never even read.
your follows data will look lopsided
Expect one or two posts to account for most of your growth. That’s normal, not a broken export. It does mean your “top 10 by follows” is often really a top 3 with a long tail, so treat the bottom of that list accordingly.
take the “most active times” with a grain of salt
Instagram tells me my audience is most active between 12 and 3. That is genuinely my slowest window, on Instagram and on the blog. We’re busiest before 11am, and it isn’t close.
So I don’t put much weight on the timing or day-of-week data at all. The demographics are worth a look, but if the app’s posting-time advice contradicts what you’re actually seeing in your own numbers, trust your numbers.
|
|
|
/ SET YOUR EXPECTATIONS A LITTLE
This might not hand you some groundbreaking revelation, and that’s completely fine. A lot of the time it just confirms what you already suspected about which posts are working.
That’s still worth a lot. There’s a real difference between “I think this kind of post does well for me” and knowing it. Once you’ve seen it in the numbers you’ll stop second-guessing it and start leaning in on purpose, which is the whole point.
|
|
/ ONE THING TO WATCH FOR
AI will confidently find a pattern whether or not one is really there. If it tells you something that doesn’t match your gut, push back and ask it to show you the posts it’s basing that on. You know your content better than it does. Use it to spot things you’d have missed, not to hand over the thinking.
|
|
Book yourself an hour this week.
Put it in your calendar right now, today, even if the hour itself is Thursday. Then when you get there: export your data, run the prompt, and see which posts land on more than one list.
If an hour isn’t happening this week, do the Edits version instead. Thirty seconds and you’ll still learn something.
Either way, post the one thing that surprised you in the Discord.
Seeing everyone’s patterns side by side is going to be fascinating, and I think you’ll spot things in each other’s that you missed in your own.
|
|
|
Talk tomorrow,
Mika
|
|
|
|